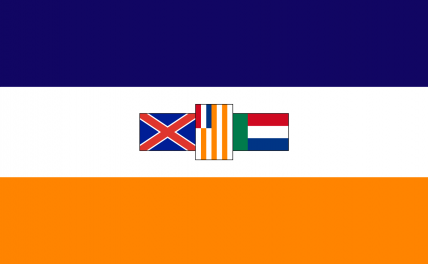
The Rainbow Nation of The South Afrikan Union
Gather 'round the banner of the right
Region: the South Pacific
Quicksearch Query: The South Afrikan Union
|
Quicksearch: | |
NS Economy Mobile Home |
Regions Search |
The South Afrikan Union NS Page |
|
| GDP Leaders | Export Leaders | Interesting Places BIG Populations | Most Worked | | Militaristic States | Police States | |

Gather 'round the banner of the right
Region: the South Pacific
Quicksearch Query: The South Afrikan Union
| The South Afrikan Union Domestic Statistics | |||
|---|---|---|---|
| Government Category: | Rainbow Nation | ||
| Government Priority: | Social Welfare | ||
| Economic Rating: | Thriving | ||
| Civil Rights Rating: | Good | ||
| Political Freedoms: | Average | ||
| Income Tax Rate: | 16% | ||
| Consumer Confidence Rate: | 103% | ||
| Worker Enthusiasm Rate: | 105% | ||
| Major Industry: | Information Technology | ||
| National Animal: | Springbok | ||
| The South Afrikan Union Demographics | |||
| Total Population: | 513,000,000 | ||
| Criminals: | 52,004,137 | ||
| Elderly, Disabled, & Retirees: | 70,325,125 | ||
| Military & Reserves: ? | 21,740,684 | ||
| Students and Youth: | 87,004,800 | ||
| Unemployed but Able: | 77,200,479 | ||
| Working Class: | 204,724,775 | ||
| The South Afrikan Union Government Budget Details | |||
| Government Budget: | $3,082,950,615,383.41 | ||
| Government Expenditures: | $2,959,632,590,768.07 | ||
| Goverment Waste: | $123,318,024,615.34 | ||
| Goverment Efficiency: | 96% | ||
| The South Afrikan Union Government Spending Breakdown: | |||
| Administration: | $355,155,910,892.17 | 12% | |
| Social Welfare: | $651,119,169,968.98 | 22% | |
| Healthcare: | $325,559,584,984.49 | 11% | |
| Education: | $355,155,910,892.17 | 12% | |
| Religion & Spirituality: | $207,174,281,353.77 | 7% | |
| Defense: | $473,541,214,522.89 | 16% | |
| Law & Order: | $59,192,651,815.36 | 2% | |
| Commerce: | $147,981,629,538.40 | 5% | |
| Public Transport: | $207,174,281,353.77 | 7% | |
| The Environment: | $0.00 | 0% | |
| Social Equality: | $29,596,325,907.68 | 1% | |
| The South Afrikan UnionWhite Market Economic Statistics ? | |||
| Gross Domestic Product: | $2,516,580,000,000.00 | ||
| GDP Per Capita: | $4,905.61 | ||
| Average Salary Per Employee: | $8,641.32 | ||
| Unemployment Rate: | 21.17% | ||
| Consumption: | $9,326,125,457,080.32 | ||
| Exports: | $1,403,240,267,776.00 | ||
| Imports: | $1,491,008,749,568.00 | ||
| Trade Net: | -87,768,481,792.00 | ||
| The South Afrikan Union Non Market Statistics ? Evasion, Black Market, Barter & Crime | |||
| Black & Grey Markets Combined: | $2,807,679,036,856.12 | ||
| Avg Annual Criminal's Income / Savings: ? | $4,017.08 | ||
| Recovered Product + Fines & Fees: | $42,115,185,552.84 | ||
| Black Market & Non Monetary Trade: | |||
| Guns & Weapons: | $139,902,961,327.80 | ||
| Drugs and Pharmaceuticals: | $161,578,068,012.39 | ||
| Extortion & Blackmail: | $133,991,568,595.64 | ||
| Counterfeit Goods: | $118,227,854,643.22 | ||
| Trafficking & Intl Sales: | $82,759,498,250.25 | ||
| Theft & Disappearance: | $94,582,283,714.57 | ||
| Counterfeit Currency & Instruments : | $173,400,853,476.72 | ||
| Illegal Mining, Logging, and Hunting : | $27,586,499,416.75 | ||
| Basic Necessitites : | $224,632,923,822.11 | ||
| School Loan Fraud : | $94,582,283,714.57 | ||
| Tax Evasion + Barter Trade : | $1,207,301,985,848.13 | ||
| The South Afrikan Union Total Market Statistics ? | |||
| National Currency: | South Afrikan Pound | ||
| Exchange Rates: | 1 South Afrikan Pound = $0.49 | ||
| $1 = 2.03 South Afrikan Pounds | |||
| Regional Exchange Rates | |||
| Gross Domestic Product: | $2,516,580,000,000.00 - 47% | ||
| Black & Grey Markets Combined: | $2,807,679,036,856.12 - 53% | ||
| Real Total Economy: | $5,324,259,036,856.12 | ||
| the South Pacific Economic Statistics & Links | |||
| Gross Regional Product: | $377,479,899,641,806,848 | ||
| Region Wide Imports: | $47,709,394,372,132,864 | ||
| Largest Regional GDP: | Curlyhoward | ||
| Largest Regional Importer: | Curlyhoward | ||
| Regional Search Functions: | All the South Pacific Nations. | ||
| Regional Nations by GDP | Regional Trading Leaders | |||
| Regional Exchange Rates | WA Members | |||
| Returns to standard Version: | FAQ | About | About | 484,089,720 uses since September 1, 2011. | |
Version 3.69 HTML4. V 0.7 is HTML1. |
Like our Calculator? Tell your friends for us... |